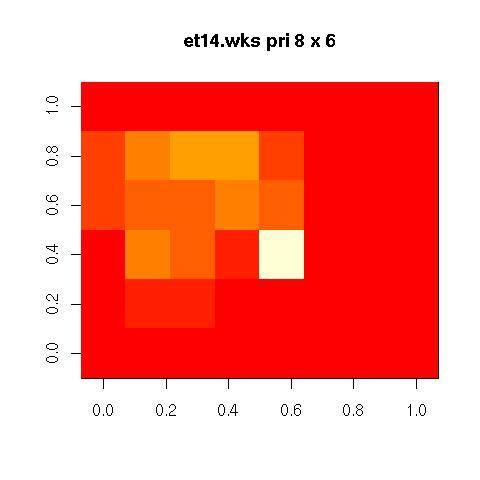
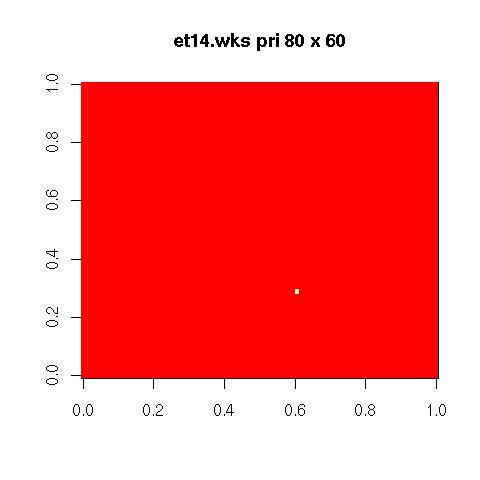
So today I was writing the end term paper for my Eyetracker project. When I was preparing presentation late at night (it’s currently 3:30am) that I have tommorow morning I was wondering why I am getting such anomalies in the visualized data:

(8×6 matrix)
 (80×60 matrix)
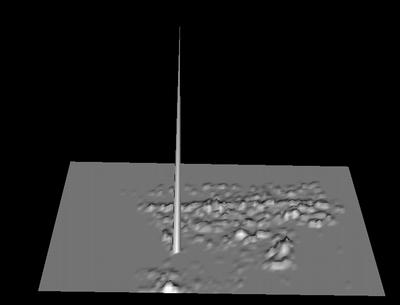
and then it hit me, maybe I don’t have normalized my data! The next thing I did was 3dsurface plot of the same data:

and now it finally makes sense. Too bad I figured out that 2 hours after I already printed the document so it’s only going into presentation. But I am still pretty happy that I at least solved this “anomalie”.